Tuesday, May 21, 2013


Day 5

  • Objective: Students will create and solve a different system of inequalities by graphing. 
  • This objective is very similar to day 4, but it is just the raw math part.  Be sure to make sure the shading in your graph correlates with the two equations.  

Quiz!
1.) Solve the system of inequalities by graphing: 
y>3x+2
y< x+2

2.) Solve the system of inequalities by graphing:
x>3
x+y< 6

3.) Solve the system of inequalities by graphing:
y>2x-5
y<2x-2


Answers to the quiz.....
1.) The shaded region represents what y could equal in both equations. 


2.)The shaded region represents what y could equal in both equations. 


3.)The shaded region represents what y could equal in both equations. 


Monday, May 20, 2013

Day 4

S represents the solution (#1)
  • Objective: Students will create and solve a system of inequalities by graphing. 
  • Similar to unit 5 day 4, when you graph an inequality you need to shade in the region according to the signs:    (<, >, <, >)  However, once you solve the two inequalities, you only shade in the region where the two lines have the same shaded area.  In other words, you don't shade in an area unless both lines' equations support it. 
  • Watch this video for how to use this concept of linear inequalities in real life: http://www.sophia.org/linear-inequalities-in-the-real-world/linear-inequalities-in-the-real-world--3-tutorial
#2

Quiz!
1.) For the picture on the top right, where do you start making profit, or where is the profit margin?
2.)For the picture on the left, where is the profit margin and when do you start making profit?
3.) For the picture below #2, (bottom left) what is the profit margin?

Answers to quiz:
1.) You would start making profit where the red line crosses the 2 on the y axis and where the blue line crosses the 2 on the x axis.
2.) You would start making profit where the solid red line crosses the 5  on the x axis and where the dotted red line crosses the 5 on the y axis. (anything above their intersection which is (2,2) The profit margin is the blue shaded region.

3.) The profit margin is the percentage of selling price that is turned into profit, or in other words the purple shaded region on the graph.  

Sunday, May 19, 2013

Day 3

  • Objective: Students will be able to solve a system of equations by addition/subtraction.
  • You can add or subtract the the equations to cancel out variables and make it easier to solve.  One equation goes on top of the other just like a regular addition or subtraction problem.  You work your way from left to right and subtract/add like terms to cancel either the y or x out.    


Quiz Time!!
1.) Solve the system using addition or subtraction:
     2x+3y=9
     2x-y=5

2.) Solve the system using addition or subtraction:
     -3x+y=0
     3x+2y=6

3.) Solve the system using addition or subtraction: 
     5x-2y=6
     3x+2y=2


Answers to Quiz:
1.) When you subtract the two equations, it cancels out the x's at first which makes it easier to solve for y.  Then when you find out what y is you can plug it back into the equation to find x.(see image below)


2.) When you add the two equations together, it cancels out the x's at first which makes it easier to solve for y.  Then when you find out what y is you can plug it back into the equation to find x.(see image below)


3.) When you add the two equations together, it cancels out the y's at first which makes it easier to solve for x.  Then when you find out what x is you can plug it back into the equation to find y.  (see image below)  


For more on how to solve a system of equations by adding/subtraction watch this: http://youtu.be/nTF6Kp_icFo

Saturday, May 18, 2013

Day 2

  • Objective: Students will solve a system of equations using substitution.
  • If you know an x or y value, you can plug it in to the other equation and solve for the variable that you didn't know.
  • This can be helpful if you are in business situations.  An example is as follows: you work at a museum and adult tickets are $5 and kid tickets are $3.  1000 people attended the museum that day and you collected $4,670. You need to find out how many adult tickets you sold and how many kids tickets you sold. To solve this, you can create two equations and use substitution to solve for the two variables. (a+k=1000....5a+3k=4,670) 

Quiz!!
1.) Solve the system using substitution:
y=3x-7
8=2y+x

2.) Solve the system using substitution:
y=8x-4
2=2y-8


3.) Solve the system using substitution:
                                                      y=5x-1
                                                      8=4x=y      


Answers to Quiz:
1.) You take the y value and plug it into the equation to solve for x and y. (see image below) 


2.) You take the y value and plug it into the equation to solve for x and y. (see image below)


3.) You take the y value and plug it into the equation to solve for x and y.  (see image below)


For more on how to solve a system of equations by using substitution watch this: http://youtu.be/KNwwu5wjcaA

Friday, May 17, 2013

Unit 6: Geometry and Construction 

Day 1: 


  • Objective: Students will solve systems of equations by graphing and demonstrating an ability to make wise business decisions.
  • Although some companies may seem cheaper than others, you have to figure out the total price for the job you want done.  For example, some companies may be cheaper for shorter periods of time, and some may be cheaper for longer periods of time.  To start, it is helpful to create an equation for each company and then graphing the equations to solve the system. 
Quiz Time!

1.) Solve the system by graphing(find the solution):
     y= x+1
     y= -5/3x+9

2.) Katey's carpet company charges a fee of $30 and then $2 per square of carpet to install. Morgan's company charges a fee of $45
but only $1 per square of carpet to install.  If a costumer wanted to install
10 squares of carpet, which company would be the cheapest? Write an 
equation for each company and then graph.

3.)Solve the system by graphing(find the solution): 
     y= 2x+7
     y= -2x+1

Answers to the quiz: 
1.) When you graph both of the lines, the point where they
intersect is the solution: 


2.) To write equations, you have to know what the y-intercept is and what the slope is.
The fees are the y-intercepts because you only pay it once(cost at zero squares.) The cost
per carpet square is the slope because that is the constant rate. Once you graph the two lines,
whichever line has the cheapest price at 10 squares is the answer. (see picture below)


3.) When you graph both of the lines, the point where they
intersect is the solution:


For more on how to solve a system of equations while graphing watch this: http://youtu.be/cuNpXve18Pc

Wednesday, May 15, 2013

Day 5
  • Objective: Students will be able to write an equation of a line given data points.
  •  To find the slope of the line, use your two points and do y2-y1 over x2-x.  To find the y-intercept (or b) you choose one of the two points and plug the y value and the x value into your new equation with the slope you found. (y=mx+b)


Quiz!!
  1. Write the equation of a line passing through the points (6,8) and (-3,5)
  2. Write the equation of a line passing through the points (2,4) and (4,8)
  3. Write the equation of a line passing through the points (5,-10) and (10,30)

Answers to Quiz:

1.)


2.)
 
3.)

Friday, May 10, 2013


Unit 5: Geometry and Construction
Day 1:
An example of what a line of best fit
could look like
  • Objective: Students will use the line of best fit to find equations of lines.
  • Make sure that your line of best fit represents the pattern of the data.  It can go between a few points, just as long as it follows the majority of the data points (as shown at the left)


Using the line of best fit to find the
equation


Quiz time!!:
1.) Define a line of best fit.
2.) On graph paper, graph the following points and then draw 
an appropriate line of best fit.
points: (1,12)(1,14)(2,10)(2,13)
(3,10)(3,12)(3,14)(4,7)(5,9)(5,11)(5,12)(7,5)(7,7)(7,10)(7,14)
(9,6)(9,8)(10,3)(11,5)(11,7)(12,3)(13,1)(14,2)(14,4)(14,6)(16,1)
(16,3)
3.) Write an equation for the line of best fit in #2. 


Quiz Answers:
1.) The line of best fit is a line put through scattered data points
that represents the data.  It can go through some points
but overall just represents the data points as a whole.


Click here for a youtube video on how to find the line of best fit: http://youtu.be/ugmhjwAQDIE


Day 2:

  • Objective: Students will write the linear equation of a line using data from a line of best fit, or given two points.  
  • Be sure to use the y=mx+b form when writing the equation.  M is the slope, b is the y-intercept and x and y are the coordinate points.  Also be sure to use y1-y2 over x2-x1 when finding the slope of the line.  
    How to find and use delta y and delta x


Quiz!
1.) Find the equation of the line to the right. >>>

2.) State what the slope and y-intercept is in the equation above.

3.) Find the equation of a line passing through the points (2,2) and (8,6)


            Quiz Answers:
  1. The equation of the line is y= 5/4x-3.  I found this by calculating the slope using delta y over delta x and finding the y-intercept.
  2. The slope in the equation above is 5/4.  This is the change in y over the change in x. (up five over four) The y intercept in the equation is -3. This is where the line crosses over the y-axis.
  3. Equation: y 2/3x+2/3  (work below)            


For more on how to find the linear equation of a line from two points watch this video: http://youtu.be/u9YZxBh1AxQ

Day 3:

  • Objective: Students will define the y-intercept in math as well as translate it to a real world meaning.
  • The y-intercept in math represents the y value (cost, time etc.) when x (months, days etc.) is zero.  An example could be a company could charge you $5 for zero hours of work, and then $10 for one hour of work.
Quiz!!                                                                           
1.) State the y-intercept on the graph below                           
 and explain what it means in the real world.                              


2.) State the y-intercept on the graph below                               
 and explain what it means in the real world.                             


3.) Explain why companies such as a cereal 
company would charge you money for zero 
ounces of cereal.

Quiz Answers
1.) The y-intercept is (0,50).
In the real world this means that
the carpet company is charging you
$50 for zero hours of work.  
2.) The y-intercept is (0,6). In the real
world this means that the cereal 
company is charging you $6 for zero
ounces of cereal.  
3.) A cereal company would charge you
money for zero ounces of cereal so that
they can pay for manufacturing for the 
cereal boxes.  They also may just be
trying to make extra money.

For an example of the real life meaning of slope watch this video: http://youtu.be/dKGiV0xwe_0


Day 4:

  • Students will graph linear inequalities.
  • When graphing linear equalities, you have to shade in the graph according to the equation.  So if y is less, then you shade in below the line you graph.  If it is greater, then you shade in above the line.  When you see that it is also equal to, the line you graph needs to be solid.  If it is not equal to, the line graphed needs to be a dotted line.  


Quiz!!

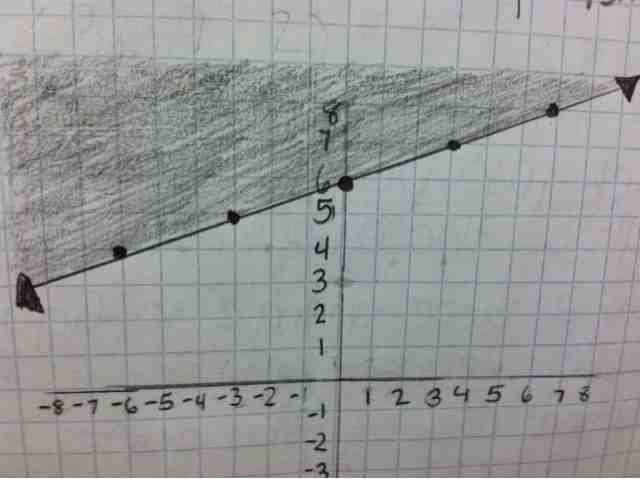
1.) Graph the inequality: y>1/3x+6
2.) Graph the inequality: y<2x-6
3.) a.) Sally has at most 60 minutes to spend on homework and sports after school. List 5 combinations of ways Sally could spend her time.
b.) Graph the the time she could spend on each and write the equation. Use H to represent homework and S to represent sports. 


Answers to Quiz:
  1. The shaded region represent what y could equal.


     2. The shaded region also represents what y could equal.

    3.


    For more on how to graph linear inequalities watch this video: http://youtu.be/0VVQYOMRlkQ

    Tips From the Pros Video: Email